How portfolio managers use risk to shape selection, balance, funding, and value decisions
At portfolio level, risk management is part of strategy because portfolio choices are investment choices under uncertainty. Selecting one component instead of another changes the organization’s expected value, exposure to loss, opportunity set, resource concentration, timing, and ability to respond later. A portfolio manager therefore works with risk before and during component selection, rather than treating risk as a separate activity that begins after the portfolio has been chosen. Portfolio research consistently frames the problem as a trade-off among value, balance, strategy, resources, and uncertainty [1][2][5].
This is especially important in PfMP terms. The exam outline separates Strategic Alignment and Portfolio Risk Management into different domains for assessment, but the work is intertwined. Risk appetite and tolerance influence which scenarios are acceptable; interdependencies influence both sequencing and risk; strategic changes can make an existing risk posture inappropriate; and governance decisions about funding or reserves depend on aggregate exposure. In practice, risk information is one of the inputs used to decide what the portfolio should contain and how aggressively it should pursue value.
Risk appetite is a strategic choice
Risk appetite expresses how much and what types of uncertainty the organization is willing to accept while pursuing objectives. It is therefore closely connected to strategic intent. A growth strategy, an innovation strategy, a cost-reduction strategy, and a regulatory strategy can produce very different desirable risk profiles. Aven connects risk appetite with organizational values, goals, acceptability, and decision making under uncertainty [8]. Enterprise-risk research similarly treats appetite as a constraint on capital allocation and return-seeking decisions [9].
The practical implication is that a portfolio manager should avoid asking only, “Which components are risky?” A more useful question is, “What combination of uncertainty and expected value fits the strategy we are pursuing?” Risk appetite helps leadership answer that question at a broad level. More specific tolerances, thresholds, and decision rules then translate that posture into component and portfolio choices.
The appetite can also differ by risk category. Leadership may accept substantial technology or market uncertainty when pursuing innovation while accepting very little safety, regulatory, cybersecurity, or liquidity exposure. Portfolio selection therefore involves more than placing every component on a single generic risk scale. The portfolio manager needs to understand which forms of uncertainty the organization is willing to carry and which forms require strong limits.
Research on the integration of enterprise risk management and strategic planning supports this strategic treatment. Firms receive more value from risk management when it is connected to strategic planning rather than operated as an isolated control activity [7]. At portfolio level, that connection becomes visible in investment choices, resource allocation, scenario selection, and the mix of components approved for execution.
Upside and downside belong in the same portfolio conversation
Portfolio risk has a downside and an upside. Downside includes the familiar threats: cost growth, delay, technical failure, demand shortfall, regulatory problems, resource bottlenecks, interdependency failures, and strategic loss. Upside includes opportunities created by uncertainty: stronger-than-expected demand, technical breakthroughs, earlier benefits, new capabilities, platform effects, optional follow-on investments, or a component that opens a valuable strategic path.
Opportunity-management research has long argued that the risk process should include positive as well as negative uncertainty [6]. At portfolio level, the point becomes even more strategic. Organizations deliberately fund uncertain work because some uncertainty carries attractive upside. The objective is therefore to pursue the right uncertainty for the expected value, while containing exposures that could damage the organization or prevent the strategy from being achieved.
This is why a highly conservative portfolio can also be strategically weak. A portfolio made entirely of low-uncertainty, incremental work may protect near-term delivery while underinvesting in growth, renewal, capability building, or strategic options. Conversely, a portfolio filled with high-upside bets can exceed the organization’s funding capacity, technical capability, or tolerance for failure. Portfolio management is the discipline of choosing the mix deliberately.
What a risk–reward bubble chart actually is
A risk–reward bubble chart is a visual portfolio map. Each bubble represents a component. Two axes show two decision dimensions, commonly some expression of expected reward or value on one axis and risk, probability of success, or uncertainty on the other. Bubble size often represents resource demand, investment, or another measure of scale. Color, shape, or labels can add information such as business unit, product line, timing, strategic category, or status.
There is no single universal set of axes. Cooper, Edgett, and Kleinschmidt documented bubble diagrams as one of the established methods used to visualize portfolio balance in product development, alongside financial and scoring approaches [1][2]. Their work includes variants based on reward, probability of success, technical feasibility, market attractiveness, cost, timing, and strategic value. The larger lesson is the method: convert a portfolio of separate proposals into a picture that exposes the pattern of the whole portfolio.
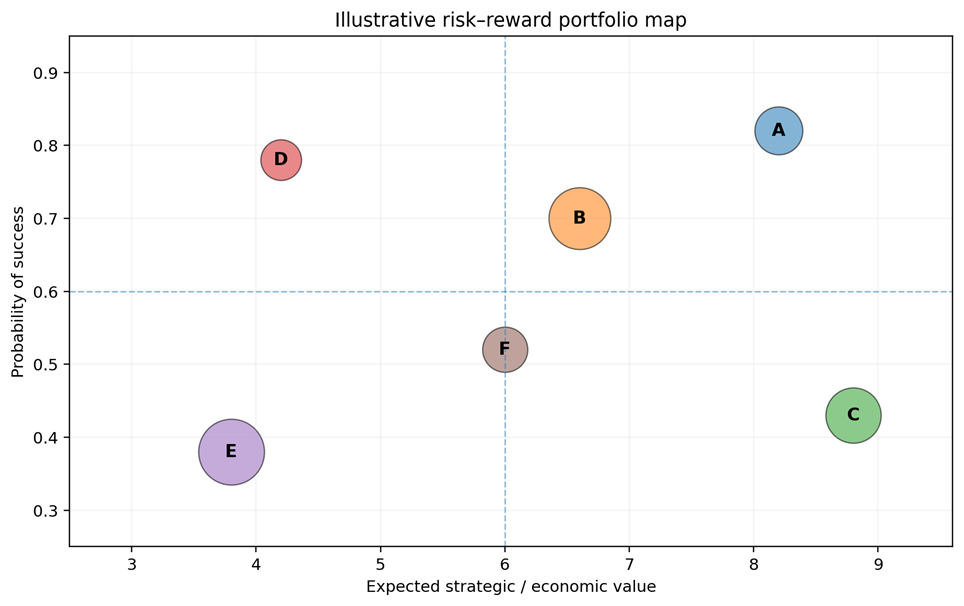
Figure 1. Original illustrative portfolio map. The axes can vary by organization; bubble size can represent resource demand or investment.
The chart above uses expected value and probability of success. A governance team could quickly see that Component A combines relatively strong value with relatively high confidence, Component C offers high potential value with much more uncertainty, and Component E consumes substantial resources while offering weaker value and lower confidence. Those observations do not automatically determine a decision. They identify where discussion and analysis should concentrate.
How portfolio managers use the chart
The main use of the bubble chart is portfolio-level sensemaking. A list of projects can make each proposal look reasonable on its own. A portfolio map exposes concentration and imbalance. Management can see whether too much investment is clustered in low-value work, whether most growth depends on a small number of uncertain bets, whether a few large components consume most of the available capacity, or whether the portfolio lacks enough initiatives in an important strategic area.
The visual is also useful for scenario comparison. The team can plot the current portfolio, then plot a proposed scenario after adding, removing, deferring, or resizing components. The discussion shifts from “Is Project X attractive?” to “What happens to the portfolio if Project X is included?” That is closer to the portfolio manager’s real decision.
Visualization research supports this use. Killen, Geraldi, and Kock found that decision makers’ use of visualizations is associated with better project-portfolio decision success, while also showing that familiarity and heuristic use matter [3]. A bubble chart therefore helps people see relationships and trade-offs, but it can also invite oversimplification if the axes or bubble sizes are treated as complete representations of value and risk.
A bubble chart is a decision aid, not an optimizer
A bubble chart is strong at showing position, concentration, balance, and relative scale. It is much weaker at representing complex interdependencies, risk correlations, sequencing effects, shared-resource bottlenecks, option value, and changing uncertainty over time. A component can look attractive as an isolated bubble while becoming much less attractive once its dependencies and resource interactions are considered.
Blau and colleagues demonstrated this point in a pharmaceutical portfolio. Their bubble-chart-based sequence provided a useful starting point, but a dependency-aware optimization and simulation approach produced a materially higher expected return at nearly the same level of risk in the case they studied [4]. The implication is practical: use the bubble chart to reveal the portfolio and structure the conversation, then use stronger analytical methods when the decision requires them.
The same caution applies to quadrant labels. Labels can help people interpret the picture, but they are management shorthand rather than universal scientific categories. The value comes from the underlying dimensions and the portfolio conversation, rather than from giving every quadrant a memorable name.
Risk changes when projects are combined
Portfolio risk is not the arithmetic sum of the risk registers from individual components. Interdependencies create portfolio-level exposure. Projects can compete for the same specialists, depend on the same platform, share suppliers, require the same regulatory approval, rely on the same market assumption, or transmit delay and technical problems to one another.
Research using fuzzy Bayesian networks has shown that interdependency effects can create portfolio risks such as liquidity pressure, cross-project resource shortages, priority imbalance, and schedule sensitivity [10]. Other work models risk propagation across projects and shows that these interactions can change the robustness of the portfolio against strategic objectives [11]. This is a major reason portfolio risk management belongs at the portfolio level rather than being delegated entirely to project and program managers.
The portfolio manager also considers concentration risk. Ten projects can look diversified because they have different names while all depending on the same technology, market, vendor, regulatory assumption, or scarce skill set. Conversely, a portfolio can contain several individually uncertain initiatives whose risks are sufficiently different that the aggregate exposure is more acceptable. Portfolio risk therefore depends on how risks interact and cluster.
Real-world tools that go beyond the bubble chart
Scoring and multi-criteria models
Scoring models and multi-criteria decision analysis combine several dimensions such as strategic fit, value, risk, technical feasibility, market attractiveness, urgency, and resource demand. They are useful when leadership needs a repeatable basis for comparing components that create different kinds of value. The score can also supply one of the axes in a portfolio map. Cooper’s practice research found strategic and scoring approaches to be prominent among stronger-performing product-development organizations [2].
Scenario analysis and Monte Carlo simulation
Scenario analysis asks how the portfolio behaves under different assumptions. Monte Carlo simulation goes further by repeatedly sampling uncertain inputs to create distributions of possible outcomes. These approaches are useful when point estimates hide the range of plausible cost, schedule, NPV, or benefit results. They help leadership see the probability of meeting targets and identify the variables that drive portfolio exposure.
Conditional Value at Risk (CVaR)
CVaR focuses attention on severe downside outcomes rather than only expected return. Dixit and Tiwari used CVaR in project-portfolio selection to compare risk-neutral, risk-averse, and compromise portfolios, explicitly linking the selected portfolio to the decision maker’s risk appetite [5]. This type of analysis is especially useful when leadership cares about what happens in bad scenarios, even if the average expected value remains attractive.
Reward–risk or efficient frontiers
A reward–risk frontier compares feasible portfolios and identifies combinations that deliver the highest expected reward available for a given level of risk, or the lowest risk available for a given expected reward. This provides a more rigorous version of the conversation suggested by a bubble chart. The point is not to discover one mathematically “correct” portfolio. The frontier exposes the trade-off set from which governance can choose a portfolio consistent with appetite, strategy, and constraints.
Real options
Real-options thinking is useful when management can stage an uncertain investment rather than commit everything at once. A component may create the option to expand, defer, abandon, switch, or make a follow-on investment after more information becomes available. This changes the risk conversation because uncertainty can have strategic value when leadership retains flexibility. Real-options methods have been applied to portfolio allocation under technical and market uncertainty and can value that flexibility more explicitly than a static NPV comparison.
Dependency and risk-propagation models
Bayesian networks, system-dynamics models, network analysis, and other dependency models help when risks move across components or when one project changes the probability or impact of another project’s risks. These techniques are more demanding than a bubble chart, but they are useful in portfolios built around shared platforms, common resources, integrated infrastructure, or tightly sequenced programs [10][11][12].
Portfolio-wide risk response optimization
Some risks are best handled within a component; others require a portfolio-level response. Ahmadi-Javid, Fateminia, and Gemünden distinguish local and global risk responses and model response selection across a portfolio while considering cost, budget, preferences, and interdependencies [13]. This supports a key portfolio principle: the best response for one component may be inferior to a response that improves the portfolio as a whole.
What strategic portfolio risk management looks like in practice
In practice, the portfolio manager interprets the organization’s strategy and appetite, identifies the forms of uncertainty that matter, and incorporates them into selection and scenario design. The manager compares alternative portfolio mixes, looks for concentration and dependency exposure, tests whether the expected value justifies the uncertainty, and surfaces choices that require governance judgment.
The manager then monitors whether the portfolio’s risk–value posture still matches strategy. New information can change probabilities, expected benefits, timing, dependencies, resource demand, or the organization’s willingness to accept uncertainty. That can lead to adding a component, accelerating it, staging it, reducing its funding, substituting another initiative, deferring it, or stopping it. Risk management therefore participates directly in portfolio rebalancing.
The most useful mindset is to treat risk as a strategic allocation question: Where should the organization take uncertainty because the upside supports its objectives? Where should exposure be reduced because the downside is inconsistent with appetite or capacity? Where are risks correlated or propagating across components? Where does staged investment preserve valuable options? And where is management consuming scarce resources without receiving enough expected value in return?
That is the portfolio-level distinction. Component managers manage the risks of delivering their work. Portfolio managers use risk to help decide which work deserves to exist, how much exposure the organization should carry, how the pieces should be combined, and when the portfolio should change.
References
[1] Cooper, R. G., Edgett, S. J., & Kleinschmidt, E. J. (1997). Portfolio Management in New Product Development: Lessons from the Leaders-I. Research-Technology Management, 40, 16–28. DOI: 10.1080/08956308.1997.11671152.
[2] Cooper, R. G., Edgett, S. J., & Kleinschmidt, E. J. (2001). Portfolio management for new product development: results of an industry practices study. R&D Management, 31, 361–380. DOI: 10.1111/1467-9310.00225.
[3] Killen, C. P., Geraldi, J., & Kock, A. (2020). The role of decision makers’ use of visualizations in project portfolio decision making. International Journal of Project Management, 38, 267–277. DOI: 10.1016/j.ijproman.2020.04.002.
[4] Blau, G., Pekny, J., Varma, V., & Bunch, P. R. (2004). Managing a Portfolio of Interdependent New Product Candidates in the Pharmaceutical Industry. Journal of Product Innovation Management, 21, 227–245. DOI: 10.1111/j.0737-6782.2004.00075.x.
[5] Dixit, V., & Tiwari, M. (2019). Project portfolio selection and scheduling optimization based on risk measure: a conditional value at risk approach. Annals of Operations Research, 285, 9–33. DOI: 10.1007/s10479-019-03214-1.
[6] Hillson, D. (2002). Extending the risk process to manage opportunities. International Journal of Project Management, 20, 235–240. DOI: 10.1016/S0263-7863(01)00074-6.
[7] Sax, J., & Andersen, T. J. (2018). Making Risk Management Strategic: Integrating Enterprise Risk Management with Strategic Planning. European Management Review. DOI: 10.1111/emre.12185.
[8] Aven, T. (2013). On the Meaning and Use of the Risk Appetite Concept. Risk Analysis, 33. DOI: 10.1111/j.1539-6924.2012.01887.x.
[9] Ai, J., Brockett, P., Cooper, W. W., & Golden, L. L. (2012). Enterprise Risk Management Through Strategic Allocation of Capital. Journal of Risk and Insurance, 79, 29–56. DOI: 10.1111/j.1539-6975.2010.01403.x.
[10] Bai, L., Shi, H., Kang, S., & Zhang, B. (2021). Project portfolio risk analysis with the consideration of project interdependencies. Engineering, Construction and Architectural Management. DOI: 10.1108/ECAM-06-2021-0555.
[11] Han, R.-Y., Li, X.-M., Shen, Z., & Jia, D.-Q. (2023). A framework of robust project portfolio selection problem under strategic objectives considering the risk propagation. Engineering, Construction and Architectural Management. DOI: 10.1108/ECAM-08-2022-0801.
[12] Bai, L.-B., Zhang, L.-W., Zhang, L.-Y., Shao, K., & Luo, X. (2025). Unlocking the potential of project portfolio: value-oriented interactive risk management. Humanities and Social Sciences Communications, 12. DOI: 10.1057/s41599-025-05296-8.
[13] Ahmadi-Javid, A., Fateminia, S., & Gemünden, H. G. (2020). A Method for Risk Response Planning in Project Portfolio Management. Project Management Journal, 51, 77–95. DOI: 10.1177/8756972819866577.
[14] Abbassi, M., Ashrafi, M., & Tashnizi, E. S. (2013). Selecting balanced portfolios of R&D projects with interdependencies: A Cross-Entropy based methodology. Technovation, 34, 54–63. DOI: 10.1016/j.technovation.2013.09.001.
[15] Cooper, R. G., & Edgett, S. J. Portfolio Management: Fundamental for New Product Success. Stage-Gate International excerpt supplied for comparison. The discussion above draws on the concepts without reproducing the source wording or proprietary quadrant descriptions.
0 Comments