Value is in the eye of the beholder…
Portfolio value begins with a deceptively difficult question: What does value mean for this portfolio?
Financial return may matter. Customer outcomes may matter. Strategic capability, regulatory compliance, operational resilience, employee capability, innovation, environmental performance, market position, learning, or social impact may also matter. Different stakeholders may assign different importance to each of these forms of value.
Portfolio research increasingly treats value as multidimensional and stakeholder-dependent. Executives, customers, functional leaders, delivery teams, regulators, investors, and other stakeholders can perceive the value of the same investment differently. Their perspectives can also change as strategy, markets, technologies, risks, and organizational priorities change.
This makes value negotiation a legitimate part of portfolio management. Stakeholders need to develop a shared understanding of the types of value the portfolio is intended to create, the relative importance of those types, and the evidence that will be accepted as demonstrating them. Research on value management describes this process through concepts such as sensemaking, negotiation, and co-creation. These processes help stakeholders translate broad concepts such as “strategic value” or “customer value” into meanings that can support actual investment decisions.
For example, one executive may interpret strategic value as direct contribution to a strategic objective. Another may emphasize market position. A technology leader may emphasize development of a reusable capability. A finance leader may emphasize future cash flows. The portfolio team needs to make those assumptions visible before it can compare investments consistently.
This negotiation creates the foundation for the value measurement framework.
The value measurement framework turns value into something we can agree on (and measure!)
A value measurement framework provides the portfolio with an agreed architecture for evaluating value. It translates the portfolio’s definitions of value into measures, indicators, proxies, scales, targets, and decision criteria.
A practical framework may begin with value dimensions such as financial, strategic, customer, operational, people, innovation, social, or environmental value. The organization can then determine which dimensions apply to a particular portfolio and how much relative emphasis each one should receive.
This is where a Value Measurement Framework Design Canvas can be especially useful. The canvas gives leaders a structured way to ask, “Which kinds of value matter here? How important are they? What kinds of evidence could represent them?” A balanced scorecard, triple-bottom-line model, custom value model, or another set of dimensions can provide an initial organizing structure.
The resulting framework can then become progressively more specific.
A portfolio might define customer value through retention, adoption, customer satisfaction, task completion, renewal rates, or service quality. It might define operational value through cycle time, unit cost, reliability, defects, throughput, or capacity. It might define strategic value through strategic contribution scores, capability creation, optionality, market position, or progress toward named strategic objectives.
The framework creates a common language for evaluating components with very different outputs.
A regulatory program and a new digital product may produce different immediate results. The regulatory program may protect the organization’s ability to operate. The digital product may generate revenue and customer growth. A well-designed framework allows each component to be assessed according to the kinds of value it is expected to create while retaining enough common structure for portfolio-level comparison.
Measures, metrics, KPIs, and proxy measures serve different purposes
The language of measurement becomes important once value dimensions have been selected.
A measure is an observed quantity or characteristic. A metric is a measure or a calculation (e.g. an average) used for management purposes. An indicator is a metric with a target and a trend. A KPI is an indicator selected for management attention because its performance has decision significance. (One might say that it's key, haha.)
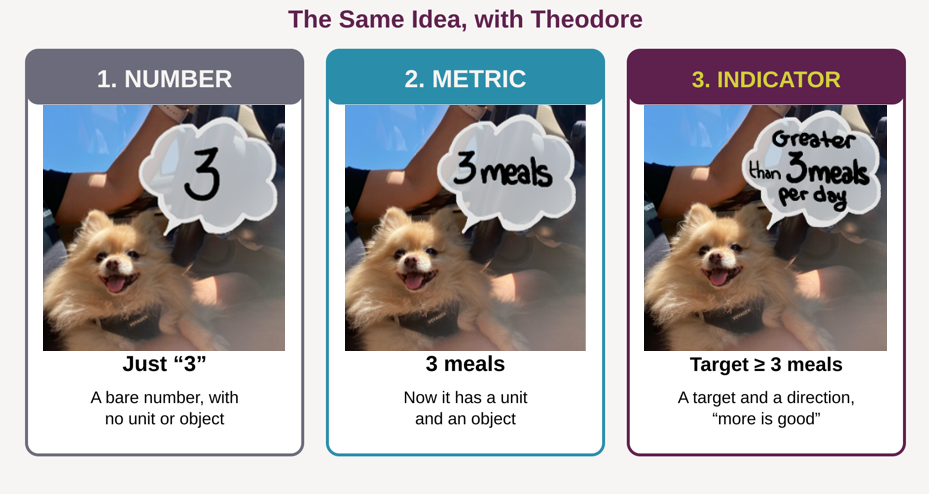
A proxy measure provides indirect evidence about a value construct that cannot yet be observed directly.
Proxy measures are especially important in portfolio management because many benefits emerge later than the decisions that fund them. Leaders still need information while those outcomes are developing.
Consider organizational capability. The ultimate value might be improved organizational ability to perform a specialized function internally. Early measures could include specialist vacancies, certification attainment, proficiency assessments, training completion, or availability of qualified personnel. Later measures might include internal mobility, reduced reliance on contractors, productivity, quality, or improved delivery performance.
These measures sit at different points in the value pathway.
Training completion measures activity. Demonstrated proficiency measures capability. Deployment of that capability measures behavior. Improved operational performance measures an outcome. Financial or strategic effects may appear later.
A strong framework identifies which type of evidence each measure represents.
Value measurement works best as a chain
The portfolio gains more information when measures are connected rather than collected as isolated KPIs.
A useful value chain can be expressed as:
Strategic objective → intended change → output → outcome → benefit → measure → target → decision
Suppose the strategic objective is to increase customer loyalty. A portfolio investment may create a redesigned customer platform. The platform is an output. Increased customer adoption is an outcome. Improved retention is a benefit. Retention percentage becomes a measure. A defined retention level becomes the target.
This structure helps prevent activity measures from being mistaken for value measures.
An organization can deliver every planned feature and still receive weak customer adoption. It can complete every training session and still develop little usable capability. It can finish a technology implementation on schedule and still generate little measurable business benefit.
Portfolio management therefore needs measures at several levels of the chain.
Leading indicators provide earlier evidence
Some value measures become observable only after substantial time has passed. Portfolio managers therefore benefit from combining leading and lagging indicators.
Leading indicators reveal conditions associated with future outcomes. Lagging indicators describe outcomes that have already occurred.
A customer portfolio might track trial usage, onboarding completion, feature adoption, conversion, or customer behavior before changes in annual retention become visible. A workforce portfolio might monitor vacancies, proficiency assessments, workload, readiness, or specialist availability before delivery performance changes. A product portfolio might track experiment results and validated assumptions before revenue develops.
The relationship between the leading indicator and the eventual outcome matters. A convenient metric has limited value when its connection to the desired result is weak.
This principle applies directly to proxy measures. A proxy gains usefulness when the organization can explain why it should provide meaningful information about the underlying value construct and can periodically test whether that relationship continues to hold.
Financial measurement remains part of the framework
Financial value remains an important dimension for many portfolios. Common measures include net present value, return on investment, internal rate of return, benefit-cost ratio, payback period, revenue contribution, margin improvement, cost reduction, cost avoidance, and changes in cash flow.
These measures answer different questions.
NPV reflects the present value of expected future cash flows. ROI compares return with investment. Payback focuses on how quickly an investment is recovered. Cost avoidance estimates expenditures prevented by an intervention. Revenue contribution measures commercial effects.
Financial analysis also depends on assumptions about timing, probability, discount rates, market conditions, operating costs, adoption, benefit duration, and other factors.
A mature framework records those assumptions because the financial number alone can conceal substantial uncertainty.
Scenario analysis, sensitivity analysis, probability-weighted estimates, and real-options reasoning can add information when uncertainty is high. Real-options thinking becomes useful when an investment creates flexibility, learning, expansion potential, delay options, abandonment options, or access to future opportunities.
Strategic and intangible value often requires structured judgment
Some forms of value have no natural monetary unit.
Strategic alignment, organizational learning, optionality, stakeholder trust, capability development, or societal value may require scoring models or structured judgment.
A scoring rubric becomes stronger when the meaning of each score is defined. A strategic contribution score of five might represent direct delivery of a named strategic objective. A score of four might represent a strong enabling contribution. Lower scores might represent progressively weaker relationships.
The scale then becomes interpretable.
Weighted multi-criteria models can combine several dimensions when portfolio comparison requires an overall score. Research on project portfolio decision analysis shows that weights can materially influence rankings and investment choices. Weights should therefore represent explicit strategic preferences rather than arbitrary percentages.
Sensitivity analysis can test how much those preferences affect the result. If modest changes in weights produce a completely different ranking, the decision carries substantial preference sensitivity. If a component remains highly attractive across many reasonable weighting schemes, its comparative value is more robust.
Targets, thresholds, and tolerances add management meaning
A metric becomes more useful when the portfolio defines what different values mean.
A target represents a desired result. A threshold identifies a point that triggers management attention or action. A tolerance defines an acceptable range of variation.
These concepts connect value measurement with governance.
A customer-retention target might be 94 percent. A threshold of 90 percent might trigger investigation. A lower threshold could trigger escalation or reconsideration of investment.
The framework should also identify the baseline. A target such as “reduce processing time by 25 percent” requires a defined starting point, measurement population, calculation method, and measurement period.
Without those details, two people can use the same KPI name while calculating different results.
Risk measurement belongs beside value measurement
Expected value always exists under uncertainty. Portfolio leaders therefore need information about the threats and opportunities that can change value.
This is where Key Risk Indicators, or KRIs, become important.
A KRI provides information about current or emerging exposure to a specific risk. KRIs can monitor risk exposure, performance deterioration, control effectiveness, or conditions associated with future problems. Thresholds can then connect those indicators to risk appetite and governance action.
Many useful KRIs function as leading indicators.
Supplier quality deterioration may precede defects or schedule disruption. Requirements volatility may precede rework and delivery problems. Specialist vacancies may precede capability shortfalls. Declining data quality may precede incorrect decisions. Control failures may precede compliance events. Capacity deterioration may precede service problems.
Other indicators capture results after they occur. Defect rates, error rates, compliance findings, cost overruns, schedule variance, incidents, and customer-impact measures provide evidence about realized performance or failure.
A mature portfolio therefore monitors both the expected value and the conditions that could change the probability of realizing that value.
Risk appetite and value appetite interact
Portfolio selection always contains a trade-off between expected value and uncertainty.
Risk appetite expresses the organization’s general willingness to accept exposure in pursuit of objectives. Risk capacity describes how much exposure the organization can absorb. Risk tolerance translates appetite into more specific limits or ranges. KRIs provide evidence about exposure. Thresholds indicate when action becomes appropriate.
These concepts can be integrated directly into portfolio value decisions.
A medical device portfolio may accept very little uncertainty around patient safety while accepting substantial uncertainty around early-stage product innovation. A financial-services portfolio may maintain tight tolerances around regulatory compliance while allowing wider tolerances for experiments in a controlled environment.
These differences matter because maximizing expected value without considering the nature of the associated exposure can produce an unattractive portfolio.
Portfolio optimization research commonly treats value, strategic alignment, resources, and risk as interacting decision variables. The resulting question becomes: Which combination of investments provides the preferred value profile within the organization’s resource and risk constraints?
Interdependencies change the value equation
Components rarely operate as isolated investments.
One project may depend on another project’s technology. A program may require a capability produced elsewhere in the portfolio. Several components may compete for the same specialist workforce. One investment may create infrastructure that increases the value of several others. Two initiatives may target the same customers and partially cannibalize each other.
These relationships change portfolio value.
Research on portfolio interdependencies identifies technical, resource, outcome, and cost-benefit relationships as recurring management concerns. These relationships can change over time, which makes static component-by-component analysis insufficient for some portfolios.
An enabling platform provides a simple example. The platform may appear relatively unattractive when evaluated only on its direct financial return. Its real portfolio value may come from enabling five subsequent customer products. Removing the platform could therefore reduce the expected value of several other components.
The opposite relationship can also occur. Two highly attractive projects can become less attractive when both require the same scarce technical specialists during the same quarter.
Portfolio managers need to understand these combined effects before interpreting component scores.
Dependencies, synergies, and shared value should be modeled explicitly
Organizations can represent interdependencies through dependency maps, benefit maps, causal models, value-driver structures, network models, scenario analysis, or more advanced simulations.
System dynamics becomes useful when interactions contain feedback loops, delays, resource competition, behavioral responses, or non-linear effects. Research using system dynamics in portfolio settings shows how apparently reasonable corrective actions can create unintended effects when uncertainty, interdependencies, planning biases, and escalation of commitment interact.
The purpose of these methods is decision insight.
A simple dependency map may be enough when relationships are straightforward. A more sophisticated simulation may be warranted when management decisions can create feedback across a large portfolio.
The analysis should consider synergy, where combined components create more value together; enabling value, where one component makes another possible; cannibalization, where one investment reduces another’s value; resource competition, where components constrain one another; and shared benefits, where several components contribute to the same outcome.
This is one reason simple addition of component business cases can overstate or understate portfolio value.
Portfolio-level measures require deliberate aggregation
Portfolio value cannot always be calculated by simply adding every component metric.
Absolute monetary values may sometimes be aggregated when their definitions, time periods, and assumptions are compatible. Ratios, percentages, scores, indices, and ordinal scales require more care.
A portfolio containing a project with 98 percent availability and another with 80 percent availability does not automatically have 89 percent availability. A portfolio containing two strategic-alignment scores cannot derive a meaningful portfolio score through simple averaging unless the aggregation method has been intentionally designed.
Portfolio research therefore emphasizes the need to synthesize component measures in mathematically and strategically meaningful ways.
Strategic importance may affect aggregation. Benefit dependencies may affect aggregation. Shared outcomes may require allocation rules. Different time horizons may require normalization.
The portfolio measurement framework should define these rules before aggregated dashboards create misleading precision.
Value requires an explicit time dimension
Value also develops over time.
A component may consume resources for two years before producing substantial benefits. Another may create immediate operating savings. An innovation investment may initially create learning and options, followed later by revenue. A regulatory initiative may preserve future operating authority rather than create an obvious incremental return.
The measurement framework should therefore distinguish current realized value, forecast value, and potential future value.
Benefit milestones can show when expected outcomes should become observable. Forecasts can be updated as evidence accumulates. The portfolio can then compare the original value proposition with the current expected value.
This distinction also helps portfolio managers recognize value erosion. (Sure that doesn't sound fun, but at least we are not talking about value leakage. Eeew.)
A component may continue delivering its scope while its expected value declines because the market changed, costs increased, benefits were delayed, adoption fell, a dependency failed, or another investment made the original solution less useful.
Value management therefore requires continued evaluation of the business proposition throughout delivery.
Rebalancing requires renewed negotiation
Portfolio value decisions rarely remain fixed for an entire planning cycle.
New information changes forecasts. Organizational strategy changes. Risks emerge. Opportunities appear. Resource availability changes. Stakeholder priorities move. Components reveal more information about feasibility and benefit potential.
Portfolio rebalancing therefore involves renewed negotiation over value.
Research on project value describes this activity through sensemaking and ongoing adjustment among stakeholders. Leaders interpret new evidence, reconsider assumptions, and negotiate trade-offs among competing forms of value.
A component that originally scored poorly on financial return may become strategically important after a regulatory change. A highly ranked product may lose attractiveness when customer adoption falls. A technology investment may become more valuable when another initiative creates a new use for its capability.
The value measurement framework supplies a common language for these discussions. Governance supplies the process through which the organization acts on them.
Value measurement needs decision rules
Measurement gains managerial value when evidence leads to decisions.
A portfolio should therefore define what happens when value indicators move outside expected ranges.
Strong evidence may support continued or increased investment. Weak evidence may trigger investigation, redesign, reduced funding, a changed delivery strategy, or termination. An emerging opportunity may justify acceleration. A dependency failure may change sequencing. A risk threshold may require additional controls or assurance.
Decision rules can be formal or judgment-based, depending on context. Either approach benefits from transparency about the type of evidence being considered.
The same metric can support different decisions at different levels. A declining adoption measure might prompt a product team to change features while prompting the portfolio governance body to revise the expected benefit forecast.
Measurement quality deserves its own governance
A value framework depends on the quality of the evidence feeding it.
Data should have appropriate accuracy, completeness, timeliness, consistency, and relevance for the decision being made. Measures should retain stable definitions when comparisons over time are intended. Changes in calculation methods should be documented.
Proxy measures deserve periodic validation because the relationship between the proxy and the underlying value can weaken.
For example, training hours may initially correlate with capability growth. Once training becomes routine, additional hours may provide little information about proficiency. A better measure may become performance assessment, role readiness, or observed use of the skill.
The portfolio should therefore review the measurement system itself.
Questions include whether the measure still represents the intended construct, whether the target remains meaningful, whether the data remain reliable, whether the metric can be manipulated, and whether the cost of collecting it remains proportionate to its decision value.
Value assurance asks whether the evidence can be trusted
A measurement framework tells the organization what it intends to measure. Value assurance provides confidence that the value proposition, supporting evidence, delivery conditions, and realization assumptions remain credible.
Assurance can examine the chain from strategy through requirements, outputs, outcomes, benefits, and expected value.
An assurance review may ask whether requirements still support the intended strategic objective, whether acceptance criteria provide meaningful evidence of fitness for use, whether component outputs are capable of producing the expected outcome, whether benefit assumptions remain reasonable, whether reported performance data are reliable, and whether major risks are being controlled.
Assurance activities can include independent reviews, audits, technical assessments, testing, validation, readiness reviews, benefits reviews, control assessments, financial reviews, or targeted analysis of specific assumptions.
Research on the UK Government Major Projects Portfolio found an association between assurance activity and improved delivery confidence over time. The findings support proportionate governance routines for initiatives with greater complexity and scale.
Assurance should follow risk and value
Every component requires some level of oversight, while the amount and type can vary.
Higher exposure, greater strategic importance, stronger dependencies, high complexity, regulatory sensitivity, large financial commitments, irreversible decisions, or severe potential consequences can justify more intensive assurance.
Lower-risk experiments may require lighter controls because the organization is deliberately purchasing information through experimentation.
This creates risk-based assurance.
Assurance resources can follow the profile of the portfolio rather than being applied uniformly. A governance body might increase review frequency for a component whose risk indicators are deteriorating. It might commission an independent technical review when a dependency becomes unstable. It might reduce oversight when evidence becomes stronger and uncertainty decreases.
The same principle applies to risk-based oversight. Review cadence, reporting depth, escalation rules, approval authority, and governance attention can vary with exposure and value significance.
Fit-for-purpose quality connects quality with value
Quality also belongs within this system because the appropriate level of quality depends on intended use.
A prototype, an internal reporting tool, a payment platform, an aircraft component, and a medical device operate under very different consequences of failure.
Fit-for-purpose quality defines the required level of reliability, performance, usability, documentation, control, testing, and compliance according to the purpose and risk profile of the output.
The portfolio can therefore connect quality requirements to value and risk.
An innovation component may deliberately tolerate failed experiments because learning is part of the intended value. A regulated component may have narrow tolerances because even a small failure can create substantial legal, safety, financial, or reputational consequences.
Quality becomes another managed trade-off rather than a universal maximum.
Risk-informed resource allocation follows the same logic
Resources represent another part of value management.
Portfolio managers allocate money, people, management attention, specialist expertise, contingency, technology capacity, and assurance effort across competing components.
Expected value provides one input. Risk provides another. Dependencies, timing, strategic importance, capacity, and opportunity also affect the decision.
A component with strong expected value may require additional specialist resources because a capability shortage threatens realization. Another component may receive less funding when new evidence lowers the probability of its benefit. A dependency may justify accelerating an enabling project because several other benefits depend on it.
Resource allocation therefore becomes dynamic.
Portfolio rebalancing changes the distribution of resources as the evidence about value and exposure changes.
Predictive portfolios can specify more of the framework early
Predictive environments often define substantial parts of the value measurement system during business-case development, authorization, and planning.
Expected benefits, financial assumptions, baselines, targets, milestones, acceptance criteria, benefit owners, realization dates, and stage-gate expectations can often be described in advance.
The portfolio can then compare actual and forecast performance with those expectations at regular review points.
Prediction still requires revision. New evidence can change benefit forecasts, risk exposure, cost estimates, assumptions, dependencies, and strategic priorities.
The framework provides continuity while the underlying estimates evolve.
Adaptive portfolios can test value more frequently
Adaptive environments create opportunities for shorter evidence cycles.
A component can express value through hypotheses and then gather evidence through increments, releases, experiments, or customer behavior.
A team might hypothesize that a new capability will increase conversion. The component can measure adoption, usage, completion rates, customer behavior, and eventual commercial results. Early evidence can then influence continued investment.
Flow measures such as cycle time, throughput, work in progress, or delivery frequency can help explain delivery capability. Product quality measures provide another layer. Customer and business outcomes provide evidence of realized value.
Adaptive value measurement benefits from separating delivery activity from business outcome. Increased velocity provides information about team delivery. Increased customer retention provides information about customer value. The two may be related, yet they answer different management questions.
Hybrid portfolios need translation across delivery approaches
Hybrid portfolios often contain components using different delivery models.
A capital project may use detailed predictive controls. A digital product may use short adaptive cycles. A research component may operate through experiments. A regulatory initiative may use formal gates and documentation.
The portfolio can preserve common value dimensions while allowing different component-level measures.
Financial contribution, strategic alignment, customer outcomes, capability development, risk, and sustainability can remain portfolio-level concepts. Each component can then define evidence appropriate to its work.
The portfolio gains comparability through common value constructs rather than identical project metrics.
Benefits need to remain visible after delivery
Some of the most important value evidence appears after project work has finished.
A completed system creates potential capability. The organization still has to adopt it, operate it, change behavior, and realize the intended benefit.
Benefits management therefore extends the measurement chain beyond delivery.
Benefit profiles or realization plans can define the expected benefit, measure, baseline, target, owner, timing, dependencies, assumptions, and sustainment requirements. The portfolio can continue tracking those measures after transition into operations.
Research on benefits realization has repeatedly linked formal benefits-management practices with stronger project success and execution of business strategy.
This connection matters because output completion provides incomplete evidence of portfolio value.
The portfolio should monitor value gained and value lost
Value measurement should also identify negative effects.
Projects can generate costs beyond their approved budget. They can increase operational complexity, create technical debt, displace employees, disrupt customers, increase environmental effects, introduce new risks, or reduce the value of another component.
These effects can be treated as negative benefits, disbenefits, expected losses, risk-adjusted value, or separate value dimensions.
The portfolio then evaluates a more complete value proposition.
A component that creates $10 million in expected benefit while creating $4 million in additional recurring operating cost has a different value profile from a component producing the same gross benefit with little additional burden.
The same reasoning applies to strategic effects. An initiative that generates near-term revenue while creating technological lock-in may have lower long-term value than the revenue number alone suggests.
A complete value-management system connects the pieces
The pieces fit together as one management system:
Strategy → negotiate value → define the value measurement framework → identify measures and proxy measures → establish baselines, targets, thresholds, and tolerances → identify risks and KRIs → analyze dependencies and synergies → allocate resources → execute and measure → provide assurance → update expected value → rebalance the portfolio → realize and sustain benefits
The value measurement framework provides the common measurement architecture within that system.
The value management processes and activities use that architecture to make decisions.
KRIs and risk thresholds show conditions that could change the probability of realizing expected value.
Interdependency analysis shows how component relationships change the portfolio-level value equation.
Assurance tests whether the assumptions, evidence, controls, outputs, and realization conditions remain dependable.
Governance determines who interprets the evidence and who has authority to act.
Rebalancing reallocates resources when expected value, risk, strategy, or conditions change.
Benefits management continues measurement until intended outcomes are realized and sustained.
A portfolio can therefore have a sophisticated value measurement framework and still require substantial management around it. The framework provides the agreed language of value. The broader portfolio system continually tests whether that value remains desirable, feasible, measurable, sufficiently supported by evidence, and worth continued investment.
References
Value Management in Project Portfolios: Identifying and Assessing Strategic Value — M. Martinsuo and Catherine P. Killen
The Management of Values in Project Business: Adjusting Beliefs to Transform Project Practices and Outcomes — M. Martinsuo
Multi-Stakeholder Perspectives of Value in Project Portfolios — C. S. Ang
Sensemaking in Value Management Practice — Michel Thiry
Measuring Portfolio Strategic Performance Using Key Performance Indicators — H. Sanchez and B. Robert
Evaluating Strategic Project and Portfolio Performance — M. Bible and Susan S. Bivins
The Value of Assessing Weights in Multi-Criteria Portfolio Decision Analysis — J. Keisler
Dynamic Portfolio Selection in Gas Transmission Projects Considering Sustainable Strategic Alignment and Project Interdependencies through Value Analysis — S. H. Ghodsypour and Maryam Ashrafi
Managing Project Interdependencies in IT/IS Project Portfolios: A Review of Managerial Issues — Sameer Bathallath, Åsa B. Smedberg, and Harald Kjellin
Project Portfolio Implementation Under Uncertainty and Interdependencies: A Simulation Study of Behavioural Responses — Lin Wang, M. Kunc, and Jianping Li
Balancing Strategic Contributions and Financial Returns: A Project Portfolio Selection Model Under Uncertainty — Yun-Tao Guo, L. Wang, Suike Li, Zhi Chen, and Yin Cheng
Project Portfolio Control and Portfolio Management Performance in Different Contexts — R. Müller, M. Martinsuo, and Tomas Blomquist
Benefits Realisation Management and Its Influence on Project Success and on the Execution of Business Strategies — C. Serra and M. Kunc
The Role of Project Manager in Benefits Realization Management as a Project Constraint/Driver — Amr Mossalam and M. Arafa
Using Leading Indicators to Improve Project Performance Measurement — Li Zheng, C. Baron, P. Esteban, Rui Xue, Qiang Zhang, and Shan-Lin Yang
Key Risk Indicators — V. Chadha and Ann Rodriguez
Value Creation Through Project Risk Management — P. Willumsen, J. Oehmen, Verena Stingl, and J. Geraldi
An Empirical Study of Assurance in the UK Government Major Projects Portfolio: From Data to Recommendations, to Action or Inaction — Hang Vo, R. Kirkham, T. Williams, Amanda N. Howells, Rick Forster, and T. Cooke-Davies
Performance Measurement Tools for Sustainable Business: A Systematic Literature Review on the Sustainability Balanced Scorecard Use — Chiara Mio, A. Costantini, and Silvia Panfilo
How Agile Organizations Use Metrics: A Systematic Literature Mapping — Stéphanie Leal, J. Hauck, Gustavo Vieira, and Monique Bertan
Clarify the five value-management activitiesSeparate the framework from its applications