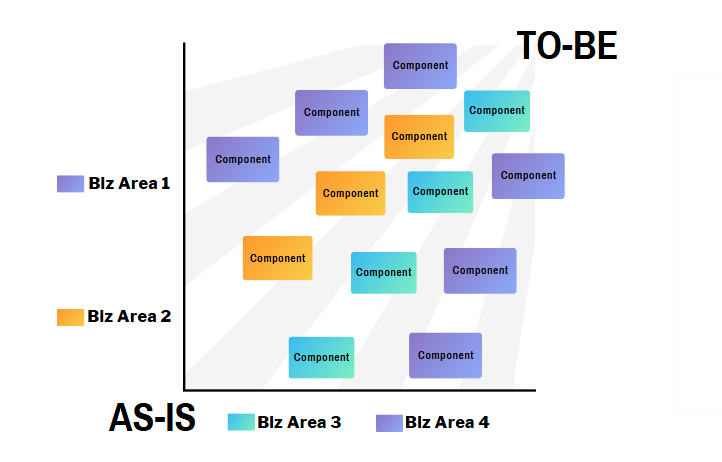
PMI recommends using an “as-is” to “to-be” visual to illustrate — at a high level — how the portfolio aligns with the organizational strategy and objectives. It’s an integrated view of overall portfolio strategy. This visual tool spans a timeline to display various business areas and the alignment of portfolio components (such as projects and programs) with organizational objectives.
The visual typically starts with the current “as-is” state on the left, showing existing projects and programs across relevant business units. Moving toward the “to-be” state on the right, it demonstrates how new initiatives will be phased in to close any strategic alignment gaps. Each component is mapped within its business area, allowing leaders to see how each area contributes to overarching strategic goals.
Want to make one? Add your info below to populate this grid:
Portfolio Evolution Planner
(After submitting, if applicable, scroll back to the top of the page to see how the visual changed.)
